Latest Tally Discloses Global Insured Disaster Losses of $144 Billion
April 10, 2018
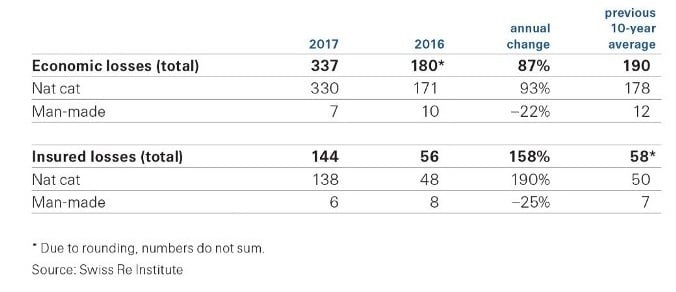
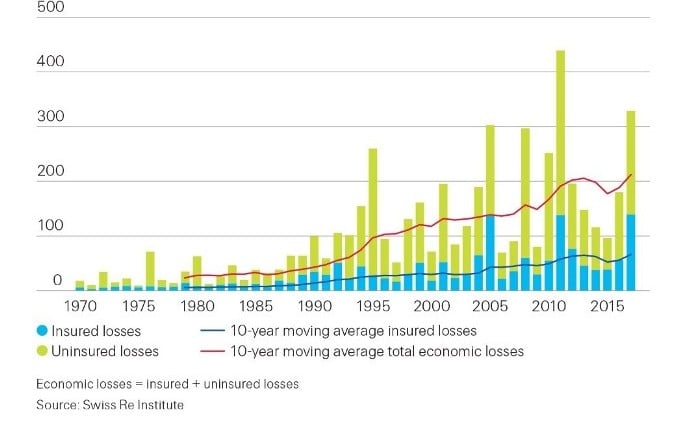
According to the latest Swiss Re Institute sigma study, total global economic losses from natural disasters and man-made catastrophes in 2017 were $337 billion, almost double the losses in 2016 and the second highest on record. Of the total losses, global insured disaster losses were $144 billion, the highest-ever recorded in a single year, leaving a worldwide catastrophe protection gap of $193 billion.
In terms of sigma criteria, there were 301 catastrophes worldwide in 2017, down from 329 in 2016. More than 11,000 people lost their lives or went missing in disaster events last year, and millions were left homeless. Natural catastrophes claimed more than 8,000 victims. A landslide and floods in Sierra Leone in mid-August took most lives, with 1,141 people declared dead or missing. Elsewhere, heavy monsoon rains and separate flood events led to more than 1,000 deaths across India, Nepal, and Bangladesh.
North Atlantic Hurricane Seasons Remain Active
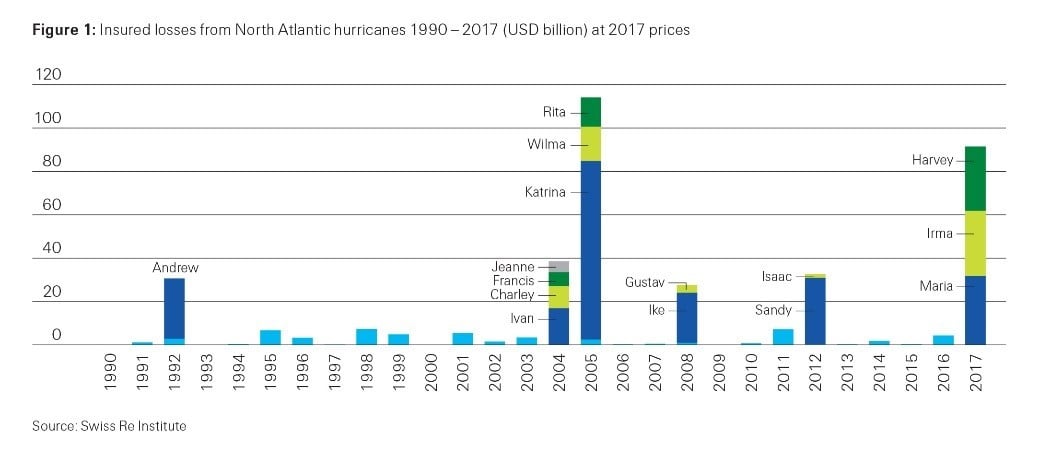
The high global insured losses from catastrophic events was mainly driven by an active hurricane season in the North Atlantic. In particular, the Harvey, Irma, and Maria (HIM) hurricanes, which all reached category 4+ intensity,1 left a trail of destruction across the Caribbean Islands, Puerto Rico, Texas, and parts of western Florida.
Table 1: Total economic and insured losses in 2017 and 2016 (USD billion) at 2017 prices
Economic Losses
According to sigma, HIM caused economic damages of $217 billion. Hurricane Irma inflicted the heaviest economic losses ever experienced in the Caribbean, and Maria essentially crippled the entire infrastructure system in Puerto Rico, including the island's power grid, its water, transport, and communications networks, and its energy facilities. A main feature of the 2017 North Atlantic hurricane season was the heavy water component of storms and the associated contribution of water damage to the overall losses. For example, Harvey unleashed an unprecedented amount of accumulated rain, causing catastrophic flooding in some of the most populated areas of the Gulf Coast, including Houston. Around 200,000 homes were flooded and 500,000 vehicles damaged. Total economic losses resulting from Harvey were $85 billion.
Insured Losses
The combined insured losses from HIM were around $92 billion, equivalent to 0.5% of US gross domestic product in 2017, making it the second costliest North Atlantic hurricane season since 2005. The study divides the storms' individual insured losses as follows: Harvey $30 billion, Irma $30 billion, and Maria $32 billion. "After 12 years of no major hurricane making US landfall,2 2017 is likely to go down as one of the most expensive North Atlantic hurricane seasons in history, in terms of both economic and insured losses," Martin Bertogg, head of Catastrophe Perils at Swiss Re, says.
The North Atlantic seems to still be in an active phase of hurricane activity, suggesting a higher probability of hurricane formation and major hurricanes making landfall. "A key take away from HIM is that insurers need to consider multiple hurricanes occurring in a given year, as much as the severity of individual events, in their modelling of hurricane risk. This is important from a risk management perspective, as it will help insurers—and, ultimately, society—be better prepared for similar magnitude events in the future," Bertogg says.
A Record Year for Wildfire Losses
The wildfires that raged across the globe last year also broke records, with combined insurance losses of $14 billion, the highest ever in a single year. In October and December 2017, separate wildfire outbreaks led to record losses of $13 billion across northern and southern California. The Tubbs fire in the Sonoma and Napa counties caused $7.7 billion in insured losses, making it the world's costliest wildfire ever in terms of insured losses, according to sigmarecords. There were also major wildfires in Canada and in Europe last year. In Portugal, high temperatures and strong winds provided the fuel for uncontrollable forest fires. The number of hectares burned from the beginning of the year through to the end of October was 53 times more than the annual average of the previous 10 years.
By the current tally, the biggest wildfire-related insured losses globally have resulted from outbreaks in the United States and Canada. This situation has come alongside an observed increase in the length of wildfire seasons (longer and warmer summers) and the occurrence of more frequent wildfire events. In North America, the increase in wildfire risk is fueled by strongly growing exposures. There has been a significant increase in development in the wildland-urban interface ((WUI), land adjacent to or within undeveloped natural areas and vegetative fuels). Since 1990, 60 percent of new homes in the United States have been built in WUI. Property in these areas is particularly susceptible to fire hazard, given its proximity to the forest and wildfire embers.
Heavy Flooding Events Caused High Losses
In 2017, there were also a number of severe precipitation events in different regions. These highlighted the vulnerability of an increasingly urbanized world to flood events. For example, Houston suffered major flooding on account of the severe precipitation that came with Hurricane Harvey. In China, heavy rains caused the Yangtze River to flood, with pluvial and river flooding across 11 provinces inundating more than 400,000 homes. The economic losses were estimated to be $6 billion, making it Asia's costliest loss disaster event in 2017. With low insurance, penetration resulted in low coverage levels. In the monsoon season, very heavy and long-running rains caused huge damage and loss of life in India, Nepal, and Bangladesh. Economic losses from a series of flood events in Bihar, Assam, West Bengal, and other states in India were around $2.5 billion, and $0.6 billion in the Terai region of Nepal.
Table 2: The most costly insured catastrophic losses in 2017 (USD billion)
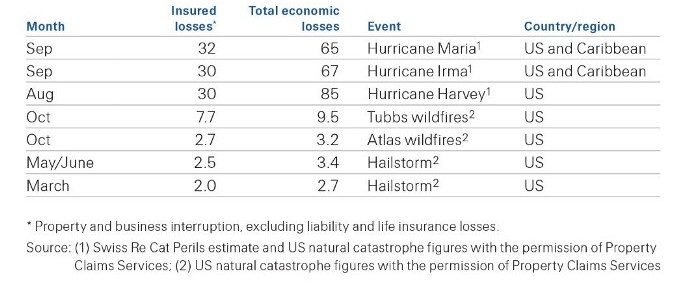
Figure 2: Insured vs uninsured losses. 1970-2017 (USD billion) at 2017 prices
- The Saffir-Simpson scale rates hurricane intensity from category 1 to 5, according to sustained wind speeds in a hurricane. Storms rated category 3 and above are considered major hurricanes. See https://www.nhc.noaa.gov/aboutsshws.php
- Hurricane Sandy in 2012 made landfall as a category 1 storm. The Saffir-Simpson scale rates hurricane intensity from category 1 to 5, according to sustained wind speeds in a hurricane. Storms rated category 3 and above are considered major hurricanes. See https://www.nhc.noaa.gov/aboutsshws.php.
The data from the study can be accessed at www.sigma-explorer.com. This mobile enable web-application allows users to create charts, share them via social media and export them as standard graphic files.
April 10, 2018
